Is It Your Site or the Whole Web? How to Diagnose a Slow Organic Traffic Decline in 2026
Diagnose a slow organic traffic decline with Search Console. Separate demand, lost clicks and ranking changes before deciding which pages need work.

When Search Console clicks fall for several months while average position barely moves, rewriting the pages is a decision that needs more evidence. Check whether the same queries still produce impressions and whether those impressions still produce clicks. A stable average can conceal lost rankings, while a page that keeps its position may face fewer searches or fewer reasons to click.
The SparkToro and Similarweb research gives that investigation useful context. Browser visits have fallen from their peak even as the internet audience has grown. The practical response is to locate your losses before changing content, rather than use the worldwide trend as an explanation for every declining page.
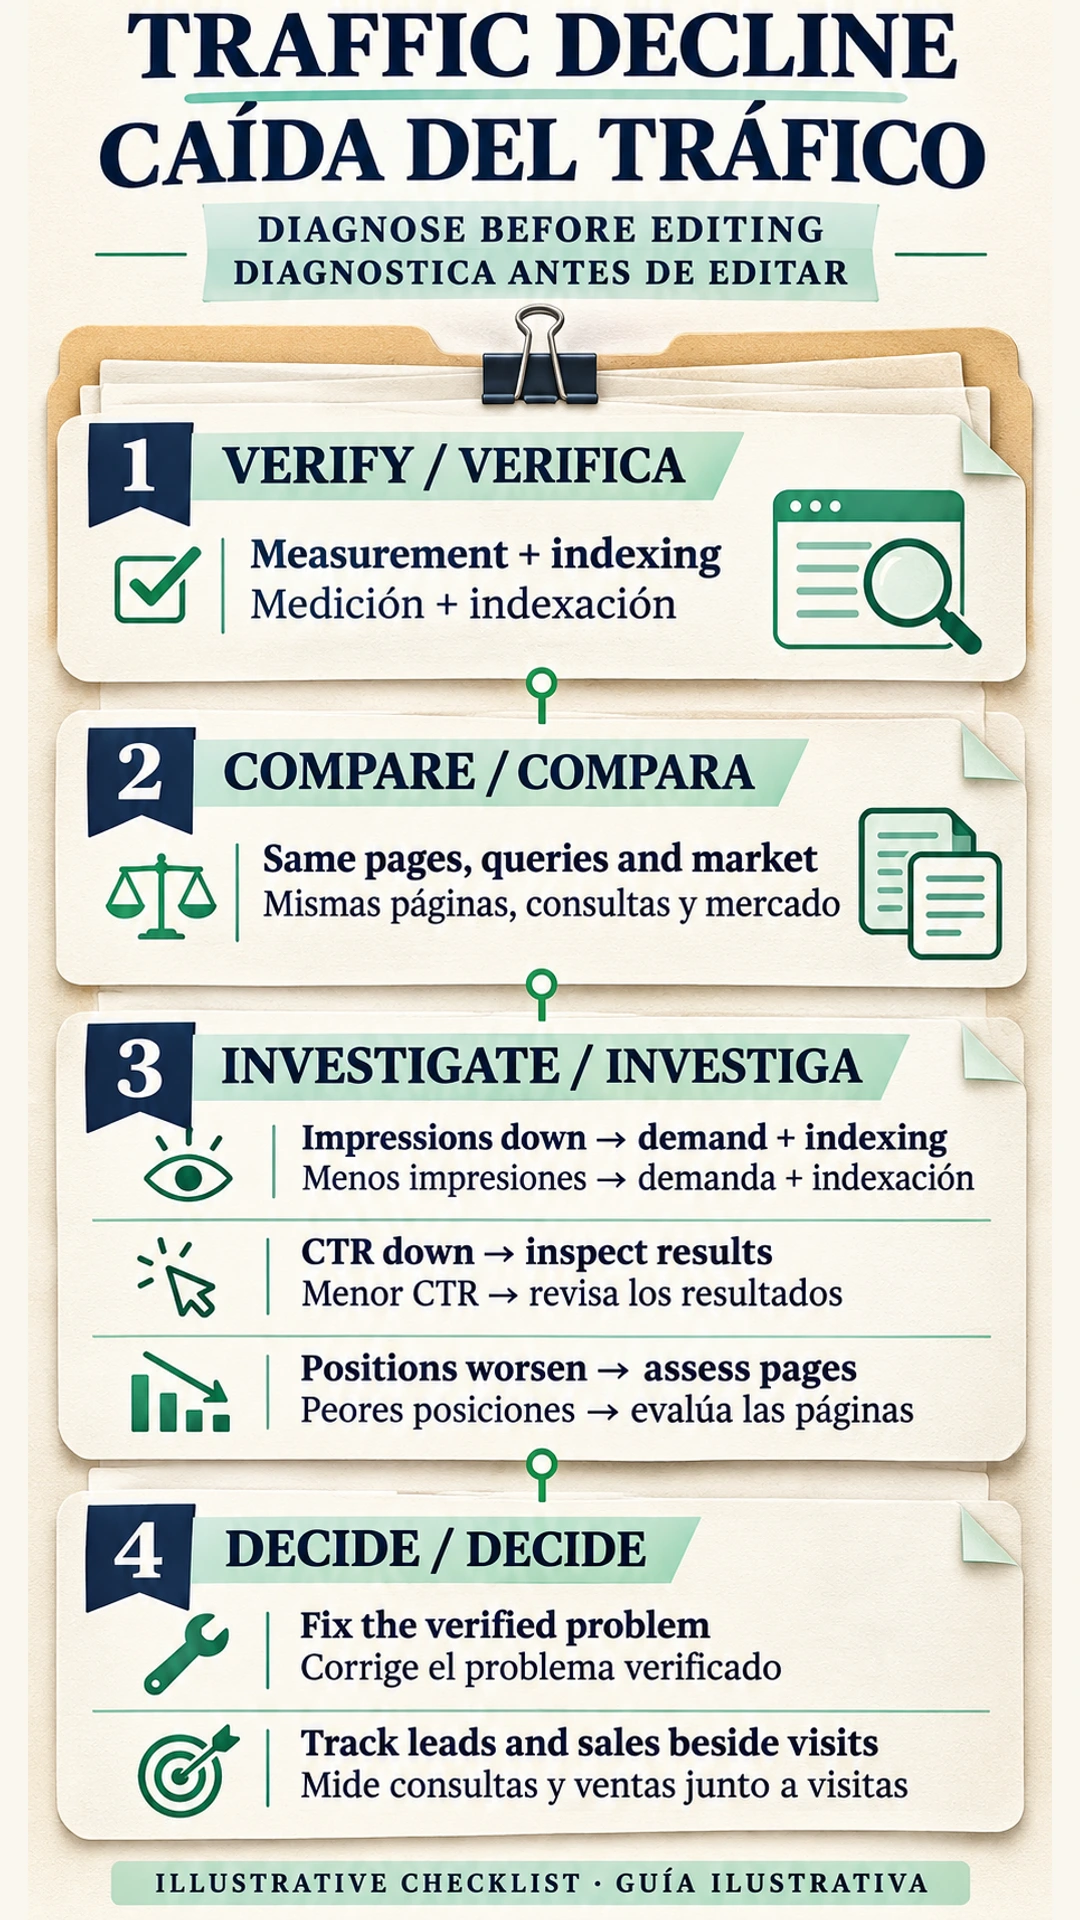
At a glance. Confirm the measurement and technical state, then compare page groups in Search Console. Separate lower demand from reduced click opportunity and lost rankings. Keep seasonality and core-update timing in their own comparisons, and report leads and sales beside sessions before deciding what to change.
The SparkToro findings and their limits
Traffic forecasts deserve a review when a growing internet audience produces fewer browser visits. In Rand Fishkin's November 10 SparkToro report, using data supplied by Similarweb, worldwide modeled visits to the top million sites peaked at 2.243 trillion in Q1 2022. The latest quarter, Q3 2026, recorded 1.970 trillion, down 12.2% from that peak. The low point was Q1 2026 at 1.914 trillion, down 14.7%.
Fishkin also reports approximately 24% more internet users and a 29.2% fall in visits per user. There is a dating discrepancy worth preserving. The post's table puts the starting 4.95 billion users in Q4 2021 and the ending 6.15 billion in Q3 2026, while its prose summary calls the starting point 2022. The table lists 5.00 billion for Q1 2022. The 29.2% figure is Fishkin's reported comparison, without a recalculation here. The “24” still present in the URL does not mean traffic fell 24%.
These figures cover mobile and desktop browser traffic worldwide, across more than organic search. App use is excluded. Regional growth can offset declines elsewhere, and the total does not establish what happened in your sector. It would be a mistake to apply the 12.2% decline as an expected loss for every site's Google traffic.
The report also leaves the cause unresolved. Fishkin raises app-only internet use, search engines or AI and social products reducing website visits, fading pandemic usage, and other possible factors. It does not identify their contributions. The distribution of visits among the top million sites changed little, so this research also fails to confirm a simple explanation of Big Tech taking an ever-larger share of browser visits. It provides grounds to question traffic assumptions, without proving that AI Overviews caused your losses.
Technical and measurement checks before a rewrite
First establish what fell. Compare the Google search clicks recorded in Search Console with the sessions recorded in analytics for the relevant landing pages. If sessions decline while clicks hold, investigate the measurement difference before treating it as evidence that the pages lost search visibility. Review tracking changes and reporting dates. Google's Performance report documentation notes that the newest data can still be preliminary.
A gradual decline also warrants technical checks. Google's traffic-drop guide gives the example of a misplaced noindex causing a slower loss as Google crawls the pages. Review the Page indexing report and inspect representative affected URLs, alongside recent changes to templates or redirects. Use the crawl and indexing diagnosis when the evidence points to missing pages. A slow graph is insufficient reason to rule out a site fault.
A comparable Search Console baseline
Open the Pages comparison and sort by lost clicks. Identify whether the loss is concentrated in a directory, a template or a few important URLs. Group explanatory articles separately from product and service pages so the next decision addresses the affected content.
Export clicks and impressions with average position and CTR for those groups. Inspect their queries, separating brand searches from non-brand searches, and compare countries and devices on the same basis. A change in the mix can alter the total without describing the same change for every group.
Google recommends using 16 months of Search Console history to recognize recurring patterns. Compare the recent 3 months with the previous period and with the same period a year earlier. Keep search types separate so a Web decline does not become a conclusion about every search surface.
Treat average position carefully. Google defines it around the topmost result from your site, averaged within the selected scope. A stable sitewide figure does not establish that the same queries held their positions. Check those queries within the affected page groups before deciding that rankings are unchanged. If a rank tracker supplied the initial alert, the ranking-data verification checks help keep that alert separate from confirmed loss.
Demand, click opportunity and ranking losses
Lower demand
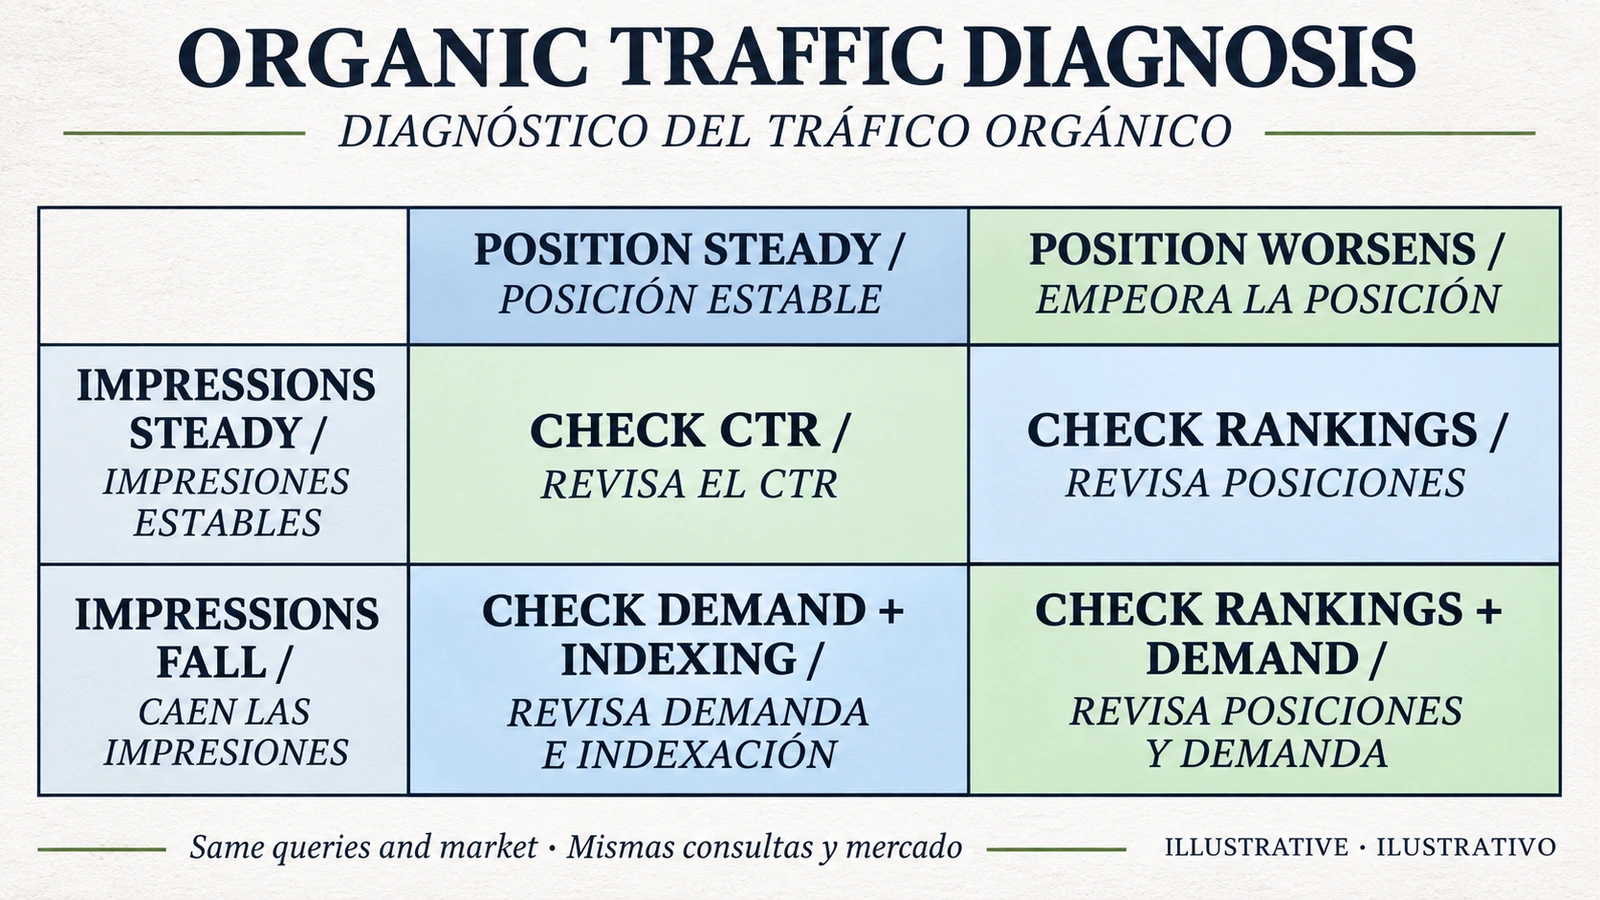
When impressions fall while positions for comparable queries hold, investigate demand before commissioning a rewrite. Check relevant searches in Google Trends for the market served and compare the prior year's pattern. Keep indexing in the investigation, because fewer impressions describe fewer appearances of your site, rather than the total number of searches across the market.
Lower demand becomes a more credible explanation when the external interest pattern agrees with your matched-query comparison. It still does not establish that the whole web is responsible for the site's decline.
Fewer clicks from comparable visibility
When impressions and matched-query positions hold but clicks fall, review CTR and the actual search results. Compare the page's snippet with the surrounding choices. Record the query and device context, with dated observations of features such as AI answers or other prominent results.
Google reports AI Overviews and AI Mode within the Web search type in Search Console. That aggregate does not isolate how much traffic an AI feature removed. A current results-page observation helps investigate click opportunity, while a historical causal claim needs more evidence than a falling CTR.
If the evidence supports reduced click opportunity, the zero-click survival strategy addresses the next question of how to respond. Diagnosis should establish which searches and pages need that response.
Persistent ranking losses
A sustained worsening of position for the same queries directs the review toward ranking and page quality, alongside technical changes. Examine the affected content against the task the searcher needs to complete and the pages currently returned. Identify a specific weakness before deciding on the edit.
Demand changes and ranking losses can coexist. Keep both explanations open when impressions fall and positions worsen. A decision table can identify the next check, but it cannot assign a precise share of the loss to each cause.
Seasonality and November core-update timing
A recurring seasonal decline needs a year-over-year comparison even when it overlaps an update. Review the same market and query groups, alongside the business calendar. A sitewide total can combine seasonal demand in one section with a different problem elsewhere.
The official November 2026 core update incident began November 10. As checked on November 12, 2026, Google had posted no completion entry and estimated that rollout might take up to 2 weeks. A decline that began months earlier cannot be attributed solely to that November start date.
Google recommends waiting at least a full week after confirmed rollout completion before comparing Search Console performance with a period before the update. Preserve the baseline and record changes while waiting. A verified technical fault still warrants attention when found. The November core update article covers the rollout assessment in more detail.
A page-change decision table
Use the evidence to choose the smallest justified action. Stable positions with fewer clicks call for a different review from pages disappearing from the index. Google's guidance also cautions against radical changes to content that is already performing well.
| Observed pattern | Next check | Page decision |
|---|---|---|
| Impressions fall, matched positions hold | Demand, seasonality and index status | Keep content intact until the comparison identifies a weakness |
| Impressions and positions hold, CTR falls | Query mix, snippets and actual results pages | Test a specific improvement supported by that review |
| Positions worsen persistently on the same queries | Affected content and recent technical changes | Improve the demonstrated weakness, then monitor the same group |
| Important URLs have an indexing fault | Inspect URLs and the affected template | Fix the verified fault rather than wait for a market recovery |
| Analytics sessions fall while Search clicks hold | Tracking and reporting differences | Resolve measurement before commissioning a search rewrite |
Client reporting with leads and sales beside sessions
The business decision should remain visible after the diagnosis. Report sessions for the affected landing pages beside qualified inquiries or sales, using consistent definitions and periods. A loss on pages that generate inquiries deserves a different budget discussion from fewer visits to content with no demonstrated contribution to those inquiries.
If visits fall while sales hold, report both without assuming that the remaining visitors are better. If the conversion rate rises, check the absolute number of conversions too. A higher rate can coexist with fewer sales, so it cannot settle the performance question by itself.
Close the review with the page group and observed loss, followed by the leading explanation and the next check that could disprove it. Give any planned edit a reason and a comparison date. That produces a reviewable decision while the global traffic trend remains context for the forecast.
Frequently asked questions
Did open-web traffic fall 24%?
No. The SparkToro report's latest summary puts Q3 2026 visits to the top million sites 12.2% below the Q1 2022 peak. Approximately 24% describes growth in internet users. The URL slug should not be used as the finding.
Can organic traffic fall while average position stays steady?
Yes. Check the same queries within comparable page groups before concluding rankings held. If they did, investigate demand and CTR. A stable sitewide average cannot isolate the cause.
Does a falling CTR prove that AI Overviews caused the loss?
No. AI Overviews and AI Mode are included in Search Console's Web performance totals. Inspect the relevant queries and actual results, but keep an AI explanation qualified unless the evidence supports a causal claim.
Should pages be rewritten during a core update?
Avoid a blanket rewrite based only on traffic or timing. Investigate verified faults immediately, while preserving the baseline for the update assessment. Google recommends waiting at least a full week after confirmed rollout completion for that comparison.
About the Author