
Real Estate SEO: The Definitive Industry Guide for 2026
How agents, brokerages, and property companies win buyers through search - backed by data from a $110 trillion market, 6 million annual home sales, and 5 property verticals.
The Real Estate Digital Marketing Scene
Real estate is the single largest asset class on Earth. The US residential real estate market alone is valued at $110.83 trillion, with approximately 6 million homes sold each year. The average real estate agent spends $12,000 per year on marketing, and that number is shifting fast: 54.2% of agent marketing budgets now go to digital channels, up from 38% just three years ago. Organic search drives 53% of all real estate website traffic, making SEO the dominant acquisition channel for property businesses.
Yet most agents and brokerages treat digital marketing as an afterthought, a social media post here, a Zillow Premier Agent subscription there. The agents who understand search are building compounding organic pipelines that deliver leads at a fraction of the cost of portal advertising, with conversion rates 5x higher than Zillow referrals.
How Homebuyers Search in 2026
52% of buyers found the home they in the end purchased online, making digital search the dominant path to a home purchase. The behavior has shifted dramatically: 70% of homebuyers now use mobile devices during their property search, and Google has tracked a 250% increase in "homes for sale near me" searches over the past three years. The long-tail matters most, queries with 4+ words drive 70% of real estate website traffic.
The search process is both longer and more fragmented than most industries. The average homebuyer spends 10-12 weeks actively searching online before contacting an agent. They visit 5-8 real estate websites, view 60+ property listings, and refine their criteria multiple times. This creates a massive content opportunity: every neighborhood guide, market report, and buyer resource page is a chance to capture a searcher before the portals do.
How Homebuyers Find Properties (2026)
The Mobile-First Property Searcher
70% of homebuyers use mobile during their search, but the behavior is subtle. Mobile dominates the discovery phase, browsing listings during commutes, checking neighborhoods on weekends, saving properties for later. Desktop takes over for deep research: mortgage calculators, school district analysis, property tax comparisons. Agents who tune only for desktop miss the majority of first-touch interactions.
The Power of Local Intent
Real estate is inherently local, and local search intent signals drive the highest-value traffic. 28% of local real estate searchers make a purchase within 24 hours. Queries like "homes for sale in [neighborhood]," "best school districts in [city]," and "[zip code] real estate market" carry buying intent that informational queries cannot match. The challenge is competing with portals for these high-intent local terms, a challenge that requires hyperlocal content portals cannot economically produce at scale.
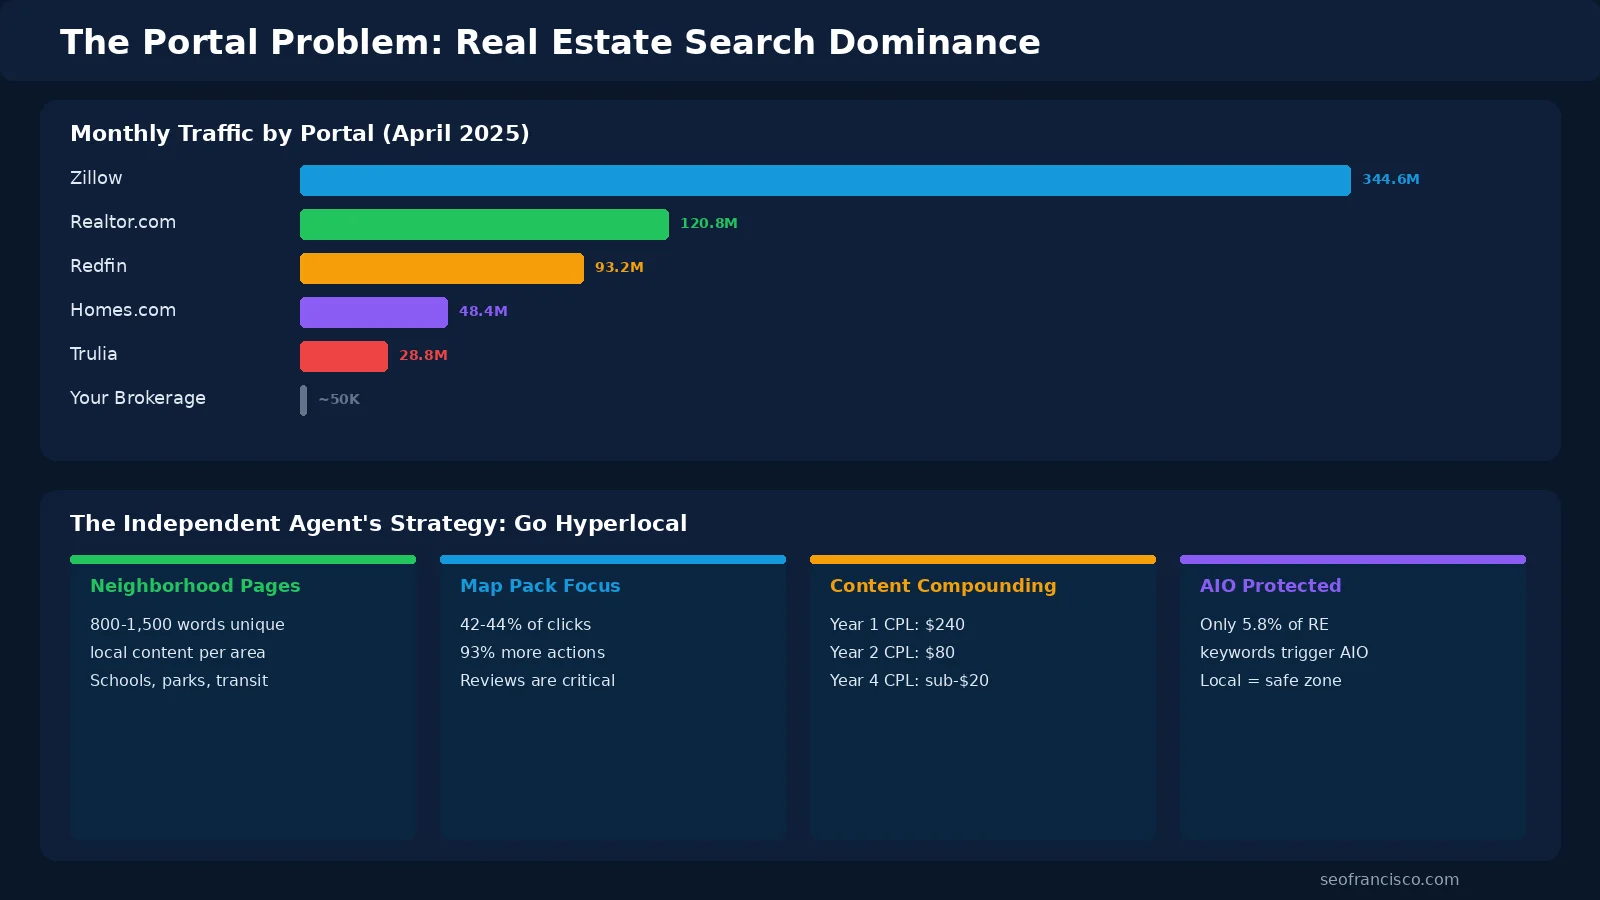
The Portal Problem: Competing with Zillow, Redfin, and Realtor.com
The single biggest obstacle in real estate SEO is portal dominance. Five websites control the vast majority of real estate search traffic, creating an oligopoly that individual agents and brokerages cannot challenge head-on for broad search terms.
Monthly Website Traffic by Real Estate Portal
Zillow alone captures 344.6 million visits per month, more than the next four competitors combined. Realtor.com follows at 120.8 million, Redfin at 93.2 million, Homes.com at 48.4 million, and Trulia at 28.8 million. These portals rank on page 1 for virtually every broad real estate query: "homes for sale," "apartments for rent," "real estate [major city]." An independent brokerage website competing for these terms is fighting a battle it cannot win.
The Hyperlocal Strategy: Where Independents Win
The winning strategy is clear: do not compete where portals are strongest, compete where they are weakest. Portals cannot economically produce unique, in-depth content for every neighborhood, school district, and micro-market in every city. An agent who creates a definitive guide to living in a specific neighborhood, covering walkability, restaurant scenes, park quality, school ratings, commute times, and market trends, builds the kind of hyperlocal authority that Zillow's algorithm-generated pages cannot replicate.
Portal Lead Quality vs. Organic
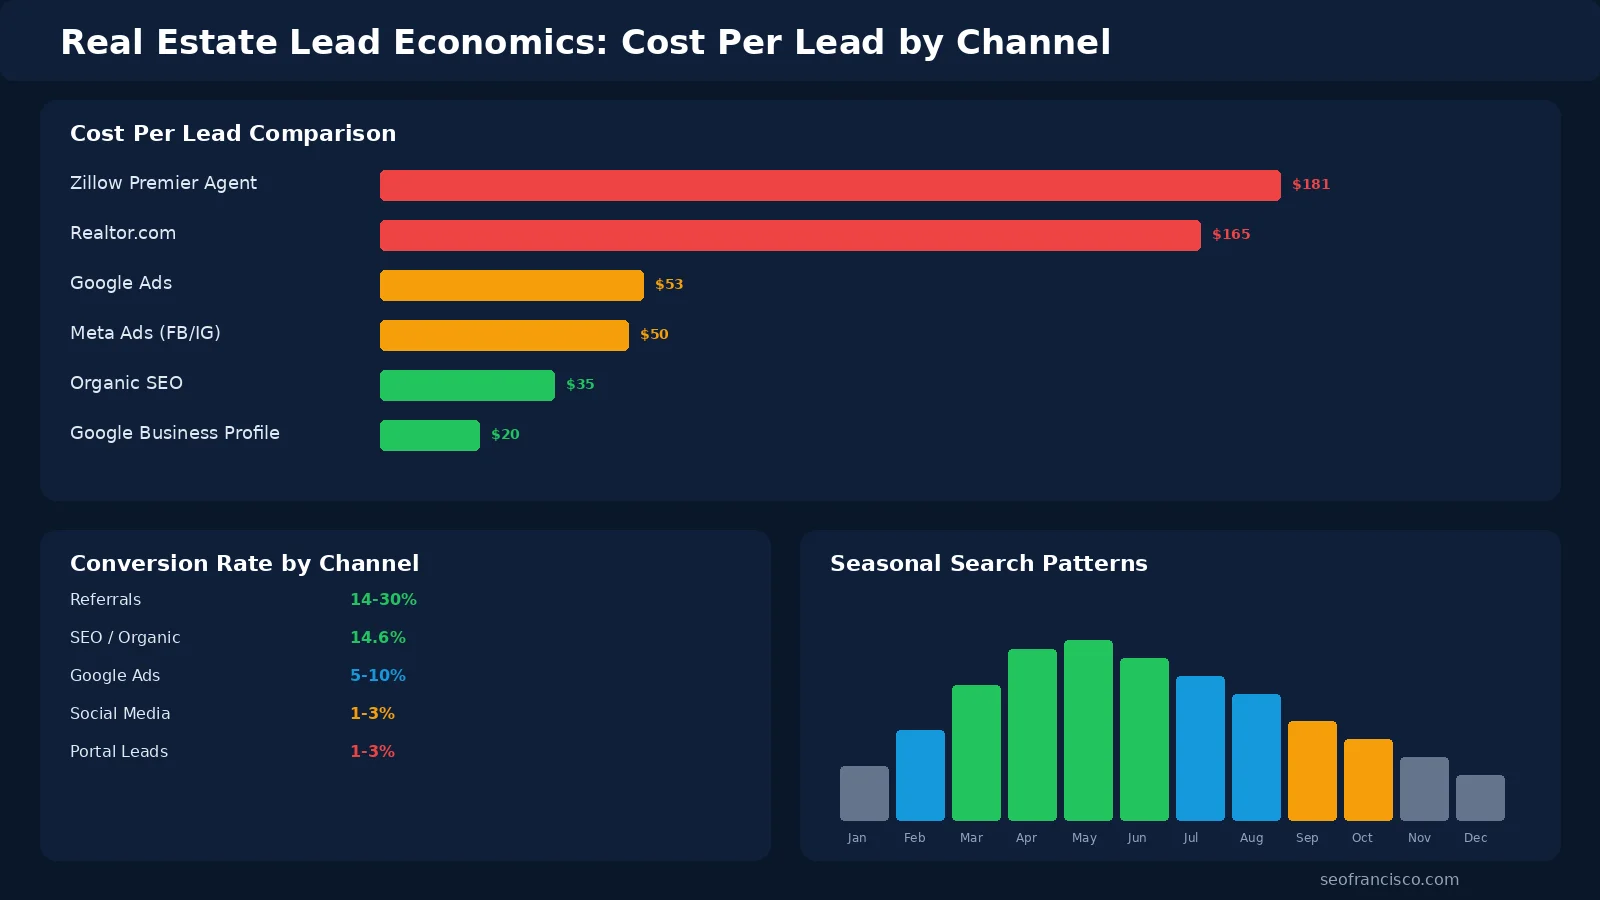
Portal leads are cheap in volume but expensive per conversion. A Zillow Premier Agent lead costs approximately $181 per lead with a 1-3% close rate, meaning the effective cost per closed deal ranges from $6,000 to $18,000. Organic SEO leads close at 14.6%, roughly 5-14x the portal conversion rate, because the buyer found your website through a specific, intent-driven search rather than clicking a generic portal ad. The math decisively favors building owned organic traffic over renting portal visibility.
Local SEO: The Real Estate Agent's Most Powerful Channel
For real estate professionals, local SEO is not a tactic, it is the foundation of sustainable lead generation. The Google Map Pack captures 42-44% of all clicks on local search results, and businesses that appear in the top 3 of the Map Pack receive 93% more actions (calls, directions, website clicks) than those that do not.
Where Clicks Go on Real Estate SERPs
Google Business Profile Optimization for Real Estate
Your Google Business Profile is your most important digital asset after your website. For real estate, GBP optimization includes: primary category set to "Real estate agent" or "Real estate agency," complete service area definitions covering your active neighborhoods, weekly Google Posts with market updates and new listings, and an active Q&A section answering common buyer and seller questions.
Reviews are the decisive ranking factor. Agents with 50+ reviews and a 4.7+ star average dominate the Map Pack in competitive markets. Review velocity matters more than total count, 4-6 fresh reviews per month signals ongoing relevance to Google's local algorithm. Our Google Business Profile case study details the full optimization plan that drives Map Pack dominance.
Neighborhood Pages: The Local SEO Multiplier
Each neighborhood page you create is a local landing page targeting a cluster of long-tail keywords: "[neighborhood] homes for sale," "cost of living in [neighborhood]," "best streets in [neighborhood]," "[neighborhood] school ratings." A well-structured neighborhood hub with 800-1,500 words of unique content per page, embedded market data, local imagery, and agent commentary can rank for 15-30 keyword variations per neighborhood. Multiply that across 30-50 neighborhoods and you have a local organic footprint that no portal can match.
The IDX/MLS SEO Dilemma
Every real estate website faces the same fundamental SEO problem: IDX (Internet Data Exchange) listing data is identical across thousands of websites. When 10,000 agent websites display the same MLS listing with the same property description, photos, and specifications, Google sees 10,000 pages of duplicate content. The result: Google indexes the portal version (Zillow, Realtor.com) and ignores the rest.
Why Most IDX Implementations Fail for SEO
| IDX Problem | SEO Impact | Severity |
|---|---|---|
| Identical listing descriptions | Duplicate content across thousands of sites. Google picks portal version | Critical |
| iFrame-based IDX feeds | Content invisible to Googlebot; zero indexing value | Critical |
| No canonical tag strategy | Google cannot determine authoritative version; splits ranking signals | High |
| Thin auto-generated pages | Thousands of near-identical pages trigger quality filters | High |
| Missing structured data | No RealEstateListing schema; no rich results eligibility | Medium |
| Slow page load from API calls | Poor Core Web Vitals; mobile ranking penalty | Medium |
How to Win With IDX Content
The solution is content differentiation on top of listing data. For every listing or neighborhood search page, add unique story content that cannot exist on any other website: agent commentary on the property, neighborhood lifestyle descriptions, commute analysis, market trend context, and personal recommendations. Implement RealEstateListing schema markup on every property page, use canonical tags pointing to your version when you are the listing agent, and noindex pages where you add zero unique value.
AI Overviews: Why Real Estate Is (Mostly) Protected
In a scene where AI Overviews are disrupting organic traffic across many industries, real estate has emerged as one of the most protected verticals. Only 5.8% of real estate keywords trigger AI Overviews, among the lowest rates of any major industry. By comparison, healthcare triggers AI Overviews on 93-100% of informational queries, and technology keywords trigger them at 40%+.
Why Real Estate Gets a Pass
Google already has specialized SERP features for property search: listing carousels, map integrations, mortgage calculators, and the Local Pack. These features satisfy user intent more effectively than a text-based AI summary could. When someone searches "homes for sale in Austin," Google shows an interactive map with listings, price filters, and photos, an AI-generated text paragraph would be a downgrade from the existing experience.
This protection extends primarily to transactional and local queries, the exact queries that drive agent revenue. Informational real estate queries ("how to buy a house," "mortgage rates 2026," "real estate market outlook") may trigger AI Overviews, but these top-of-funnel queries carry less direct conversion value. The queries that matter most for lead generation remain safely in traditional organic territory.
The Real Estate SEO Strategy Plan
A complete real estate SEO program follows eight phases, each building on the last. This plan applies whether you are a solo agent, a regional brokerage, or a national property management company, the scale changes, but the sequence does not.
Technical Foundation
Site speed optimization (sub-2.5s LCP), mobile-first architecture, crawlable IDX implementation, XML sitemaps for listing pages, canonical tag strategy for duplicate listings, Core Web Vitals compliance.
Google Business Profile
Complete profile optimization, category and service area setup, review generation system targeting 4-6 fresh reviews/month, weekly Google Posts with market insights and new listings.
Hyperlocal Content Hub
Build 30-50 neighborhood guides (800-1,500 words each) covering lifestyle, schools, market data, commute analysis, and agent insights. Target "[neighborhood] homes for sale" clusters.
Listing Page Differentiation
Add unique agent commentary, property narratives, neighborhood context, and RealEstateListing schema to every active listing. Noindex expired listings after 30 days or convert to sold-data pages.
Market Report Engine
Monthly market reports by city and neighborhood with median prices, days-on-market, inventory levels, and trend analysis. These pages earn links, establish authority, and rank for "[city] housing market" queries.
Buyer & Seller Resource Center
Full guides: first-time buyer checklists, mortgage calculators, home valuation tools, staging guides, relocation resources. Target top-of-funnel informational queries that portals underserve.
Link Building & PR
Local link acquisition through community sponsorships, chamber of commerce memberships, local news citations, and market data that journalists reference. Target 10-15 quality local links per quarter.
Seasonal Optimization
Publish spring market content 6-8 weeks before peak season. Adjust CPC bids and content calendar around seasonal search patterns. Front-load listing content for March-April search volume spikes.
Real Estate SEO by Vertical
Real estate is not a monolithic industry. Five distinct verticals each present unique SEO challenges, keyword landscapes, and conversion dynamics. A strategy that works for residential brokerage will fail for commercial real estate or vacation rentals.
Residential Brokerage
Hyperlocal strategy, highest search volume, neighborhood-level content, review-driven local SEO. Average transaction $420K. CPC $2.37-5.50.
- Neighborhood guides are the primary ranking asset
- Review velocity is the Map Pack differentiator
- IDX differentiation determines listing page value
- Seasonal optimization critical (March-June peak)
Commercial Real Estate
B2B audience, longer decision cycles (6-18 months), smaller keyword volumes, higher transaction values. CPL $150+. CPC $4-12.
- Target decision-makers: investors, developers, CFOs
- Market analysis and cap rate content ranks well
- LinkedIn and industry publication link building
- Longer content cycles match longer buying cycles
Luxury Real Estate
Lifestyle-focused search intent, visual-first UX, brand authority critical. 25-40% CPC premium over standard residential. Average transaction $1M+.
- Lifestyle keywords: "waterfront estates," "gated communities"
- Image SEO and video tours drive engagement
- E-E-A-T through press features, awards, exclusivity
- International buyer targeting for gateway markets
Vacation Rentals / STR
Destination-focused search, extreme seasonal spikes, direct-booking SEO vs. Airbnb/VRBO. Platform disintermediation is the primary goal.
- Compete with Airbnb/VRBO for "[destination] vacation rental"
- Destination guide content earns booking-intent traffic
- Publish peak season content 8-12 weeks in advance
- Local activity and event content builds topical authority
Property Management
Tenant-focused search intent, reputation management essential, local multi-location SEO. Reviews are the dominant ranking and conversion signal.
- "Apartments for rent in [city]" is the primary keyword cluster
- Tenant reviews directly impact vacancy rates
- Multi-location GBP management at scale
- Amenity and floor plan pages create ranking depth
ROI & Seasonal Patterns: Timing Your Investment
Real estate SEO delivers the highest ROI of any agent marketing channel, but only if you understand the cost structure and seasonal dynamics. SEO is an investment that compounds, meaning the cost per lead drops dramatically over time as your organic authority grows.
Cost Per Lead by Acquisition Channel
Lead Conversion Rate by Channel
The numbers tell a decisive story. Google Business Profile leads cost approximately $20 per lead, organic website leads cost ~$35, Google Ads cost ~$53, and Zillow Premier Agent leads cost ~$181. But cost per lead is only half the equation. SEO leads close at 14.6%, Google Ads at 5-10%, and portal leads (Zillow, Realtor.com) at just 1-3%. When you factor in both CPL and close rate, organic SEO delivers the lowest cost per closed transaction by a wide margin.
The Compounding Effect
SEO ROI compounds in a way no other real estate marketing channel can match. In Year 1, your CPL may be around $240 as you build content, earn authority, and wait for rankings to mature. By Year 4, that same organic infrastructure delivers leads at sub-$20 CPL, because the content you created in Year 1 is still ranking and generating leads at zero marginal cost. A Zillow subscription, by contrast, resets to zero the moment you stop paying.
Seasonal Search Volume Patterns
Real Estate Search Volume by Month
Real estate search follows a predictable seasonal curve. January is the lowest-volume month, with searches climbing steadily through February and March. The peak search window is April through June, with April representing the sharpest month-over-month increase. Search volume declines gradually through summer, drops more steeply in fall, and bottoms out in December-January.
The strategic implication: publish your spring market content, neighborhood guides, and buyer resources 6-8 weeks before peak season, meaning February is the critical content production month. CPCs also rise 15-30% during April-May, making organic rankings even more valuable during peak season when paid alternatives are most expensive.
Real Estate SEO: Frequently Asked Questions
How long does real estate SEO take to show results?
Can a solo agent compete with Zillow in search results?
How much should a real estate agent invest in SEO?
Is IDX bad for SEO?
Why are my Zillow leads not converting?
Do I need separate pages for every neighborhood?
How do seasonal patterns affect real estate SEO strategy?
Real Estate SEO Case Study
How a regional brokerage built hyperlocal content authority to outrank portals and generate 340% more organic leads within 12 months.
Read the case study →Google Business Profile Optimization
The complete GBP plan that drives Map Pack dominance, review velocity, post strategy, and local signals that generate 93% more actions.
Read the case study →Explore More Industry Guides
Ready to Build a Real Estate SEO Pipeline That Compounds?
We build hyperlocal, portal-proof SEO programs for agents, brokerages, and property companies, from Map Pack dominance to neighborhood content that converts.
Get a Real Estate SEO Audit →