
E-commerce SEO: The Definitive Industry Guide for 2026
How online retailers, DTC brands, and marketplace sellers drive revenue through organic search - backed by data from a $7.41 trillion global market and 6 retail verticals.
The E-commerce Digital Marketing Scene
Global e-commerce sales will reach $7.41 trillion in 2026, up from $4.28 trillion in 2020. The United States alone accounts for the largest single-country market, with the DTC segment projected at $239.75 billion. This is not a niche vertical, it is the dominant mode of commerce, and organic search is its single largest acquisition channel. The average e-commerce brand allocates 9.4% of total revenue to marketing. Of that budget, SEO investment typically ranges from $500 to $15,000 per month, depending on catalog size, competitive density, and the technical complexity of the platform. Brands investing at the higher end consistently report compounding returns after month six because organic search, unlike paid media, builds equity.How Consumers Search for Products in 2026
The most important data point for any e-commerce SEO strategist: 63% of US consumers now start product searches on Amazon, not Google. This does not mean Google is irrelevant, it means the nature of Google product search has changed. Google captures the research phase (reviews, comparisons, "best X for Y" queries) while Amazon captures transactional intent.Where Product Searches Start
Mobile Commerce Dominance Mobile commerce has crossed the majority threshold:
$2.4 trillion in 2026, representing 57-59% of all e-commerce sales. This is not a "mobile-friendly is nice to have" situation. If your product pages load in more than 3 seconds on a mid-range Android device over LTE, you are losing the majority of your addressable market. The mobile shift has specific SEO implications. Google's mobile-first indexing means the mobile version of your site is the version Google evaluates. Product image galleries, size charts, and review carousels must render fully on mobile, not behind JavaScript tabs that Googlebot may not execute. ### Voice Commerce Voice shopping has grown to a $62-150 billion market (estimates vary by methodology), and 49.6% of US consumers now use voice assistants for some form of shopping activity. The SEO implication: voice queries are overwhelmingly long-tail and conversational. "Best waterproof running shoes under 150 dollars" is a voice query structure. Brands with FAQ schema, natural-language product descriptions, and speakable structured data capture these queries at near-zero marginal cost.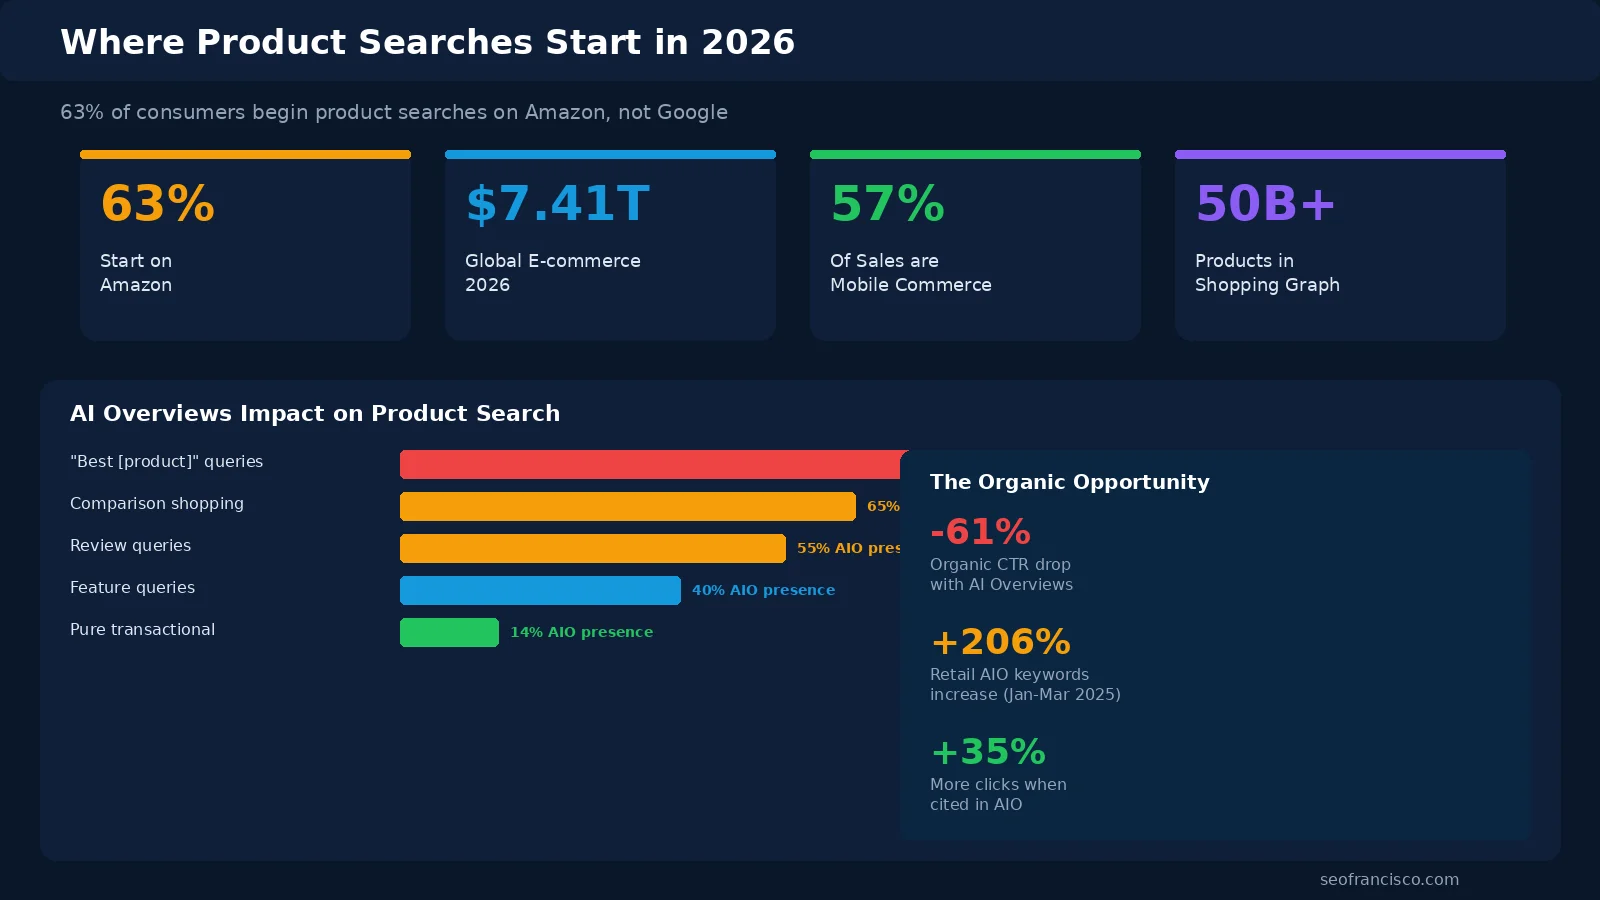
Technical SEO: The E-commerce Minefield
E-commerce sites face technical SEO challenges that content sites never encounter. The core problem is combinatorial URL explosion: a catalog of 1,000 products with faceted navigation (size, color, price, brand, rating, material) can generate 10,000+ indexable URL combinations. Without deliberate crawl budget management, Googlebot wastes its allocation crawling parameter variations of the same product while ignoring your new collections entirely. ### Faceted Navigation and Crawl Waste The math is stark. A fashion retailer with 2,000 SKUs across 6 filterable attributes (size, color, brand, price range, material, rating) generates a theoretical maximum of 2,000 x 6^6 = 93 million URL permutations. In practice, robots.txt rules, canonical tags, and noindex directives reduce this, but poorly implemented faceted navigation is the number one technical SEO failure mode in e-commerce.Page Speed and Conversion The relationship between page load time and conversion rate is not linear, it is exponential decay. Conversion drops
4.42% for every additional second of load time. At the same time, 63% of mobile users bounce if a page takes more than 4 seconds to become interactive.Conversion Rate vs. Page Load Time
JavaScript Rendering and Product Data Modern e-commerce platforms (headless Shopify Hydrogen, Next.js storefronts, Nuxt commerce) increasingly rely on client-side JavaScript to render product data. Google's rendering pipeline has improved, but there is still a measurable delay between crawl and render. Products loaded via JavaScript are indexed 3-7 days slower than products rendered in the initial HTML response. For time-sensitive inventory (seasonal products, limited drops, flash sales), this delay is a revenue-impacting problem. The fix is server-side rendering or static site generation for all product pages, with client-side hydration for interactive elements (add-to-cart, variant selectors, reviews). This approach gives Googlebot clean HTML on first crawl while preserving the user experience.
Google Shopping and the Product Graph
Google's Shopping Graph now indexes 50 billion+ product listings from across the open web, merchant feeds, and product reviews. This is the largest structured product database ever assembled, and it powers not just Google Shopping tabs but also rich product results in organic search, AI Overviews, and Google Lens visual search. ### The Schema Advantage Products with correctly implemented Product schema markup rank an average of 3.2 positions higher in organic results and see 20-40% CTR improvement from rich snippets (price, availability, review stars, shipping info). This is the highest-ROI technical SEO task in e-commerce: every product page should have complete Product JSON-LD.Free Merchant Listings Google Merchant Center now supports
free product listings, brands no longer need to pay for Google Shopping placement. Schema-only inclusion is now possible: if your Product JSON-LD includes price, availability, brand, and GTIN, Google can pull your products into Shopping results without a Merchant Center feed. This levels the playing field for DTC brands that previously could not afford Shopping Ads. The optimal approach is a dual pipeline: Merchant Center feed for completeness and control, plus Product JSON-LD on every product page for organic Shopping Graph inclusion. Brands running both see an average 15-22% increase in total product impressions versus feed-only approaches.AI Overviews: The Product Search Disruption
AI Overviews have altered the economics of product search visibility. The organic CTR impact is severe: sites that previously ranked in positions 1-3 for product queries now see a 61% drop in click-through rate when an AI Overview appears above the organic results. The category-level data reveals the strategic calculus. "Best [product]" queries, the highest-intent informational-commercial queries in e-commerce, now trigger AI Overviews 83% of the time. Pure transactional queries ("buy [product] online") trigger AI Overviews only 13-14% of the time. And retail-related AI Overview keywords have increased 206% year-over-year.AI Overview Presence by Query Type
The Strategic Response The brands adapting to
AI Overviews are doing three things. First, they are optimizing for AI citation by front-loading factual claims, specifications, and comparison data in the first 150 words of product and category pages. Second, they are building topical authority clusters around product categories so Google's LLM cites their domain repeatedly. Third, they are shifting budget toward transactional queries where AI Overviews are less prevalent and purchase intent is highest.Conversion Optimization: From Traffic to Revenue
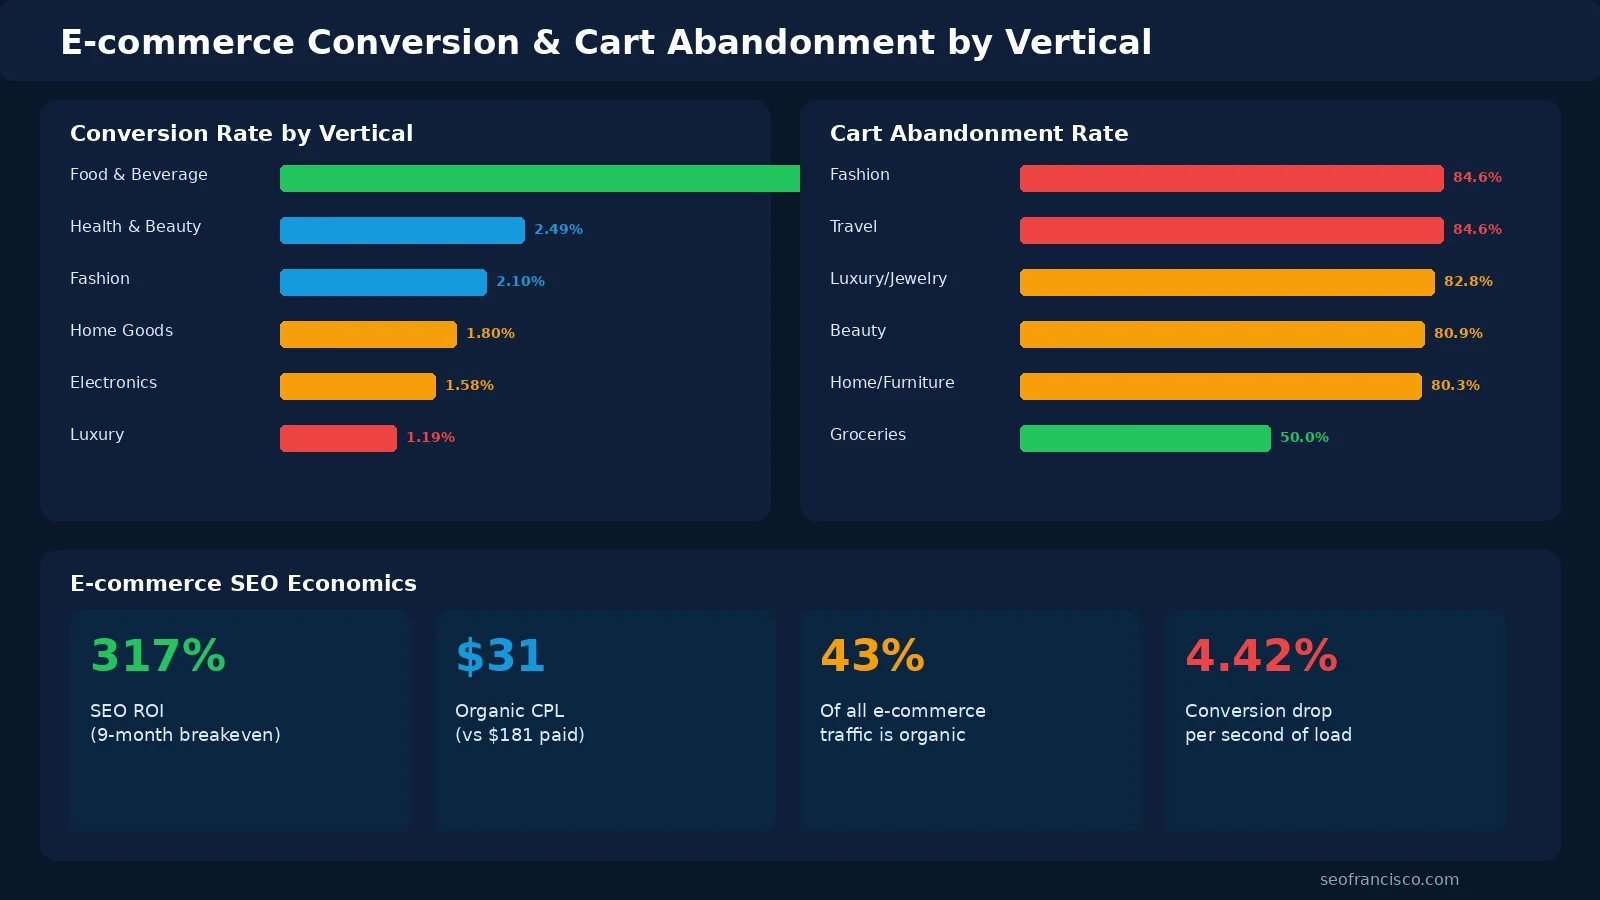
Traffic without conversion is a vanity metric. The average e-commerce conversion rate from organic search is 2.7-3.0%, meaning for every 100 visitors, roughly 3 buy something. Paid search converts at 2.81-7.52% depending on vertical, but at dramatically higher acquisition cost. The arbitrage opportunity in organic is clear: lower CAC, comparable conversion rates, and compounding traffic over time.Conversion Rates by Retail Vertical
Cart Abandonment: The $4 Trillion Problem Global cart abandonment runs at
70-78% across all e-commerce. The variation by vertical is significant, fashion leads at 84.61% (size uncertainty), while food and beverage is lowest at approximately 51% (low-risk, repeat purchases). Every percentage point reduction in cart abandonment is worth more than any ranking improvement for most mid-size retailers.Cart Abandonment by Vertical
The E-commerce SEO Strategy Plan
Based on engagements across six retail verticals, this is the eight-phase plan that consistently delivers compound organic growth for e-commerce brands.Technical Audit & Crawl Architecture
Map every indexable URL. Identify crawl waste from faceted navigation, parameter variations, and duplicate product pages. Implement canonical strategy and robots.txt rules. Target: reduce crawlable URLs by 40-70%.
Product Schema Deployment
Implement Product, Offer, AggregateRating, and BreadcrumbList JSON-LD on every product page. Include price, availability, GTIN, brand, and review data. Validate against Google Rich Results Test.
Category Page Optimization
Category pages are the ranking engines for head terms. Add 300-500 words of unique copy, internal links to top products, FAQ schema, and filter-state canonical management. Target: rank category pages for "[category] + [modifier]" queries.
Core Web Vitals & Page Speed
Achieve sub-2.5s LCP on product pages. Eliminate layout shifts from lazy-loaded images and price/variant selectors. Target INP under 200ms. Image optimization alone typically saves 40-60% of total page weight.
Content Hub & Buying Guide Strategy
Build topical authority with buying guides, comparison pages, and educational content that links to product and category pages. This captures the research phase before the consumer goes to Amazon for purchase.
Merchant Center & Shopping Graph
Submit product feed to Google Merchant Center. Sync with on-page Product schema for dual-pipeline visibility. Tune product titles and descriptions for Shopping-specific ranking factors (category match, price competitiveness).
AI Overview Optimization
Front-load factual product specifications, comparison data, and expert commentary in the first 150 words. Build entity authority through consistent NAP, brand mentions, and structured data. Target AI citation for "best X" queries.
Measurement & Iteration
Track organic revenue (not just traffic), conversion rate by landing page, crawl stats, and indexed page count. Monthly iteration cycle: identify underperforming categories, fix technical regressions, scale what converts.
E-commerce SEO by Vertical
Each retail vertical has distinct search behavior, competitive dynamics, and conversion characteristics. The following data represents median performance across our client portfolio and industry benchmarks.| Vertical | CAC Range | Conversion Rate | Key Challenge | Organic Traffic Share |
|---|---|---|---|---|
| Beauty & Cosmetics | $25 - $50 | 2.49% | Ingredient queries, UGC reviews | 38 - 42% |
| Food & Beverage | $15 - $35 | 6.11% | Local delivery, freshness, subscriptions | 35 - 40% |
| Fashion & Apparel | $30 - $80 | 2.06% | 84.61% cart abandonment, size uncertainty | 30 - 38% |
| Electronics | $40 - $120 | 1.58% | Spec comparison, Amazon dominance | 25 - 32% |
| Home Goods | $25 - $65 | 2.35% | Visual search, room-context queries | 45 - 55% |
| Luxury | $80 - $250 | 1.19% | Brand protection, counterfeit signals | 28 - 35% |
Beauty and Cosmetics The beauty vertical is driven by ingredient-focused searches ("niacinamide serum for oily skin"), influencer-adjacent queries ("best dupe for Charlotte Tilbury"), and UGC review signals. Customer acquisition costs of $25-50 are among the lowest in e-commerce because the search volume is massive and commercial intent is high. Our
beauty e-commerce case study details how ingredient-led content strategy increased organic revenue 340% in 8 months. ### Food and Beverage DTC Food and beverage has the highest conversion rate in e-commerce at 6.11%, consumers searching for food products have immediate purchase intent and low consideration cycles. The technical challenge is subscription SEO: optimizing for "monthly [product] delivery" and "best [product] subscription box" queries that drive lifetime value. Our food and beverage DTC case study covers the full subscription SEO playbook. ### Fashion and Apparel Fashion has the highest cart abandonment rate at 84.61%, driven primarily by size uncertainty. The SEO strategy must integrate size guide content, virtual try-on schema, and return policy prominence. Faceted navigation management is critical here, color/size/brand filter combinations create the largest URL explosion of any vertical. ### Electronics and Consumer Tech Electronics faces the steepest Amazon competition, with consumers defaulting to Amazon for spec comparisons and price matching. The organic strategy for electronics brands is to own the research layer: detailed comparison content, benchmark data, and expert reviews that Google surfaces before the consumer shifts to Amazon for purchase. ### Home Goods and Furniture Home goods has the highest organic traffic share of any vertical at 45-55% because visual search, room inspiration, and style-matching queries ("mid-century modern coffee table walnut") are poorly served by Amazon's functional product listings. This vertical rewards rich visual content, room scene photography, and style guide content hubs. ### Luxury Luxury e-commerce has the lowest conversion rate (1.19%) and highest CAC ($80-250) but also the highest average order value. SEO strategy for luxury focuses on brand protection (outranking aggregators and counterfeit resellers), editorial authority, and experience-driven content that communicates brand values without discounting.ROI: The Economics of E-commerce SEO
The financial case for e-commerce SEO is built on three numbers: cost per lead, payback period, and lifetime compounding. Organic search delivers a cost per lead of $31 versus $181 for paid search, a 5.8x efficiency advantage. The overall ROI of e-commerce SEO programs averages 317% with a 9-month breakeven period. After breakeven, every additional month of organic traffic is free marginal revenue.Cost Per Acquisition by Channel
The Compounding Effect Unlike paid channels where traffic stops the moment you stop spending, organic traffic compounds. A product page that ranks #3 for a 10,000 monthly search volume keyword delivers approximately 1,200 visits per month, indefinitely, at near-zero marginal cost. Over 24 months, that single page ranking generates the equivalent of $43,000 in paid search value (at a $3.00 CPC) for a one-time optimization cost of $200-500.
Related Case Studies
Beauty E-commerce SEO
How ingredient-led content strategy and product schema drove organic revenue growth for a DTC beauty brand in 8 months.
Read the case study →Food & Beverage DTC SEO
Subscription SEO, local delivery optimization, and content-driven organic growth for food and beverage direct-to-consumer brands.
Read the case study →Schema Markup for E-commerce
Product, Offer, and AggregateRating schema implementation that lifted rankings 3.2 positions and CTR by 20-40%.
Read the case study →AI Overviews Optimization
Strategies for maintaining organic visibility when AI Overviews reshape the product search scene.
Read the case study →Frequently Asked Questions
How much does e-commerce SEO cost per month?
If 63% of product searches start on Amazon, why invest in Google SEO?
How do faceted navigation and filters affect e-commerce SEO?
What is Google's Shopping Graph and how do I get my products in it?
How badly do AI Overviews impact e-commerce organic traffic?
What conversion rate should I expect from organic e-commerce traffic?
How long does it take to see ROI from e-commerce SEO?
Explore More Industry Guides
Ready to Build Your E-commerce Organic Engine?
15 years of SEO strategy across DTC, marketplace, and enterprise retail. From technical architecture to AI Overview optimization, get a senior-level assessment of your e-commerce search opportunity.
Book a Strategy Consultation →