How to Diagnose Organic Traffic Shifts With Semrush What Has Happened Reports
A practical SEO workflow for using Semrush Enterprise What Has Happened Organic Research reports to find keyword, URL, topic, path, and market share changes after traffic moves.

63-Second SEO Shift Recap
Watch the Short Before You Read
A quick breakdown of how to diagnose organic traffic movement by market share, winning URLs, topic clusters, and competitor shifts.
How to Diagnose Organic Traffic Shifts With Semrush What Has Happened Reports
TL;DR: Most SEO reporting starts with the wrong question. "Did traffic go up or down?" is only the alert. The better question is: which competitors gained visibility, which topics moved, which URLs changed, and which market signals explain the shift?
Aleyda Solis recently highlighted Semrush Enterprise's What Has Happened (Organic Research) report as a faster way to answer that question. The real value is not a nicer dashboard. It is a diagnostic sequence that connects market movement, share of voice, keyword winners and losers, URL winners and losers, and path-level change into one story an SEO team can act on.
Organic traffic reporting has a bad habit: it gets emotional before it gets diagnostic. A chart drops. A stakeholder asks what happened. The SEO team opens Google Search Console, filters by date, exports pages and queries, and spends the next few hours trying to reconstruct the story manually.
That work still matters. You should not replace first-party data from Google Search Console or analytics with third-party estimates. But first-party data usually tells you what happened to your own site. It does not quickly tell you whether competitors gained, whether a SERP changed shape, whether Reddit or YouTube absorbed the demand, or whether the whole topic cluster shifted away from the page type you were relying on.
That is where a Semrush-style "what changed" report becomes useful. It gives you a market lens before you overfit the diagnosis to your own domain.
Why Monthly SEO Reporting Misses the Real Story
A monthly SEO report often says something like this:
- Organic sessions were down 12% month over month.
- Clicks from non-branded queries dropped 8%.
- Three landing pages lost most of the traffic.
- Average position moved from 6.4 to 7.1.
Those numbers are useful, but they are still self-centered. They do not explain whether the market moved around you.
If your top commercial page loses traffic, there are at least five possible explanations:
- A competitor improved and took the ranking.
- A different page type started winning the SERP.
- A larger publisher or platform entered the result set.
- A SERP feature reduced classic organic clicks.
- Search demand changed and everybody lost traffic.
Those scenarios require different fixes. Updating copy will not solve a SERP that shifted from service pages to comparison pages. Link building will not solve a query that now rewards fresher product data. A technical fix will not solve a decline caused by YouTube, Reddit, or a dominant aggregator entering the result set.
This is the reason I like the report angle Aleyda pointed out. A good organic shift report should force the SEO team to look outside its own property before recommending work.
What the Report Is Trying to Answer
Based on the examples Aleyda shared, the Semrush Enterprise report is designed around a simple operational question: what changed in organic search during a selected period?
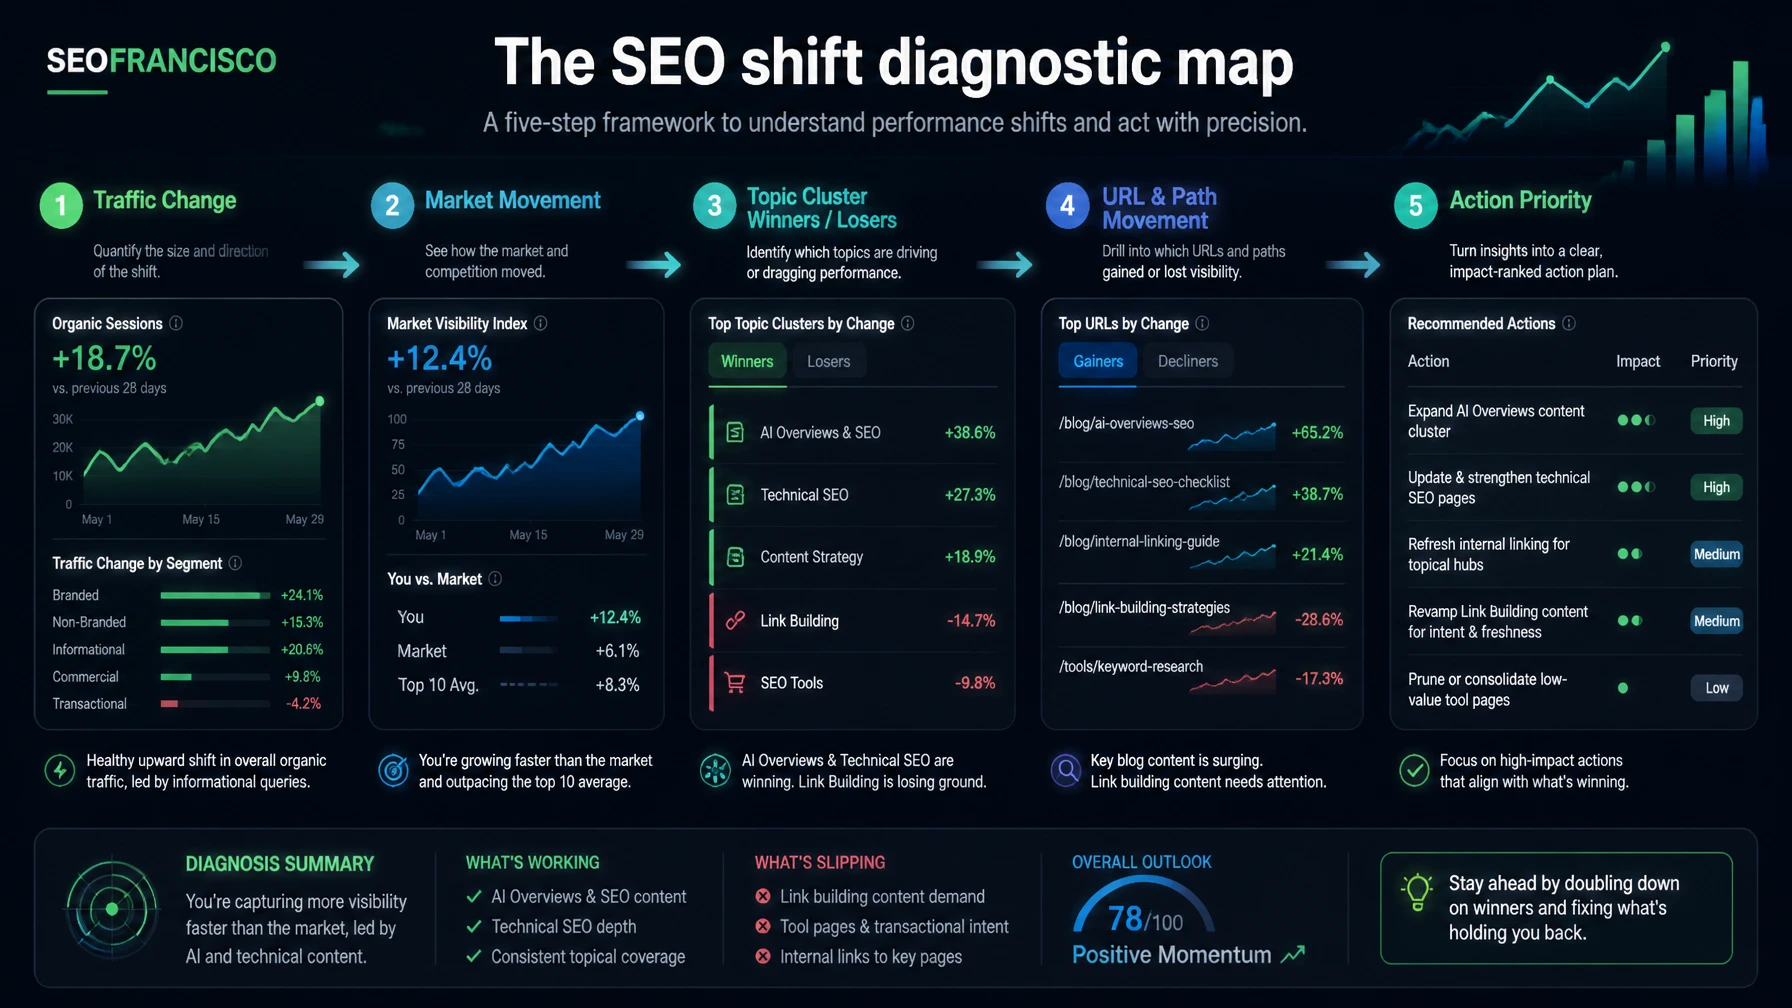
The useful layers are:
- Keyword and topic cluster winners and losers: which demand areas gained or lost visibility.
- URL winners and losers: which specific pages moved enough to matter.
- Path winners and losers: whether a whole directory, content type, marketplace section, or template family is moving.
- Market analysis: which competing domains have more traffic or keyword share for the same keyword set.
- Market development: which competitors increased or decreased most during the same period.
That last part is the missing piece in many reports. When you only analyze your own clicks, you can see loss. When you analyze the market, you can see transfer.
There is one wording caveat: Semrush traffic is estimated. Semrush's own Organic Rankings Positions documentation explains that traffic estimates are based on organic positions and expected monthly visits. That is different from GA4, server logs, or Search Console clicks. Treat Semrush traffic as directional competitive intelligence, not as a replacement for your first-party measurement.

The Bubble Chart Question: Who Captured the Demand?
The screenshot Aleyda shared shows a market analysis bubble chart with traffic change on one axis and share of voice on the other. This is the kind of view that can save a reporting meeting from becoming guesswork.
Read it like this:
- High share of voice, positive traffic change: the market leader is getting stronger.
- Low share of voice, positive traffic change: a smaller player may be breaking through.
- High share of voice, negative traffic change: a dominant site may still lead, but the market is redistributing.
- Low share of voice, negative traffic change: a weaker competitor may be losing relevance or losing a template family.
The practical move is to label every competitor by type before drawing conclusions. In many verticals, the "competitor" list will mix direct businesses, publishers, YouTube, Reddit, Wikipedia, marketplaces, directories, and Google-owned surfaces. Those are not all business competitors, but they are search competitors.
That distinction matters. If YouTube gains share for your target keyword set, the answer might be video content and transcript distribution. If Reddit gains, the answer may be community proof and independent discussion. If a direct competitor gains, the answer may be page quality, authority, freshness, internal links, digital PR, or conversion-focused topical depth. If Google itself gains more visual or AI answer surface, the answer may be structured extraction and query targeting.
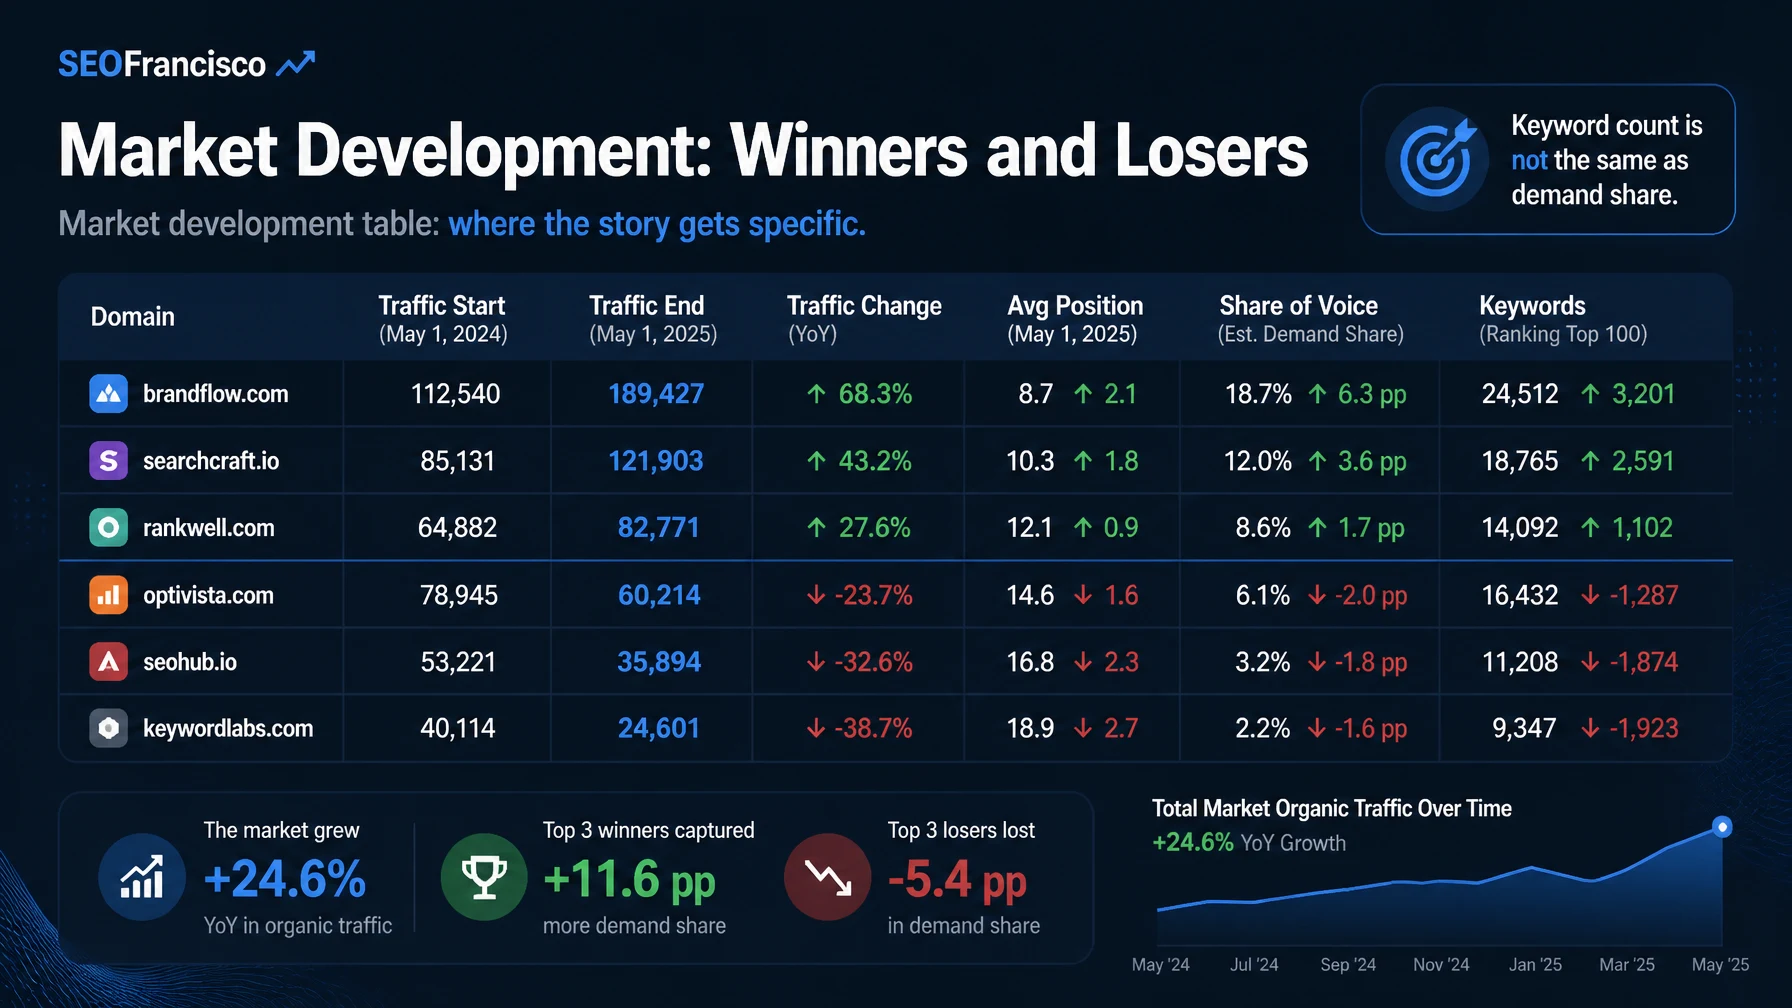
The Market Development Table: Where the Story Gets Specific
A chart points you toward the story. A table helps you prove it.
The Market Development screenshot Aleyda shared includes columns for traffic start, traffic end, traffic change, average position start, average position end, share of voice start and end, and keyword start and end. That combination matters because one metric can mislead you.
For example:
- A competitor can gain keywords but lose average position.
- A competitor can lose rankings but gain traffic if it improves on high-volume terms.
- A competitor can gain traffic without a meaningful share of voice change if the market is large.
- A competitor can lose total keywords while becoming stronger in the terms that matter commercially.
This is why share of voice is useful. Semrush's Position Tracking documentation describes share of voice as weighted by search volume and estimated traffic, not only keyword count. In practice, that means one major query can matter more than dozens of long-tail keywords.
When a stakeholder asks "why did traffic decline?", the answer should not be "we lost 43 keywords." The better answer is closer to: "We lost visibility on two high-volume commercial clusters, while one direct competitor and one publisher gained share of voice. The issue is concentrated in our comparison page template, not the whole site."
Diagnose by Layer, Not by Panic
Here is the workflow I would use after a sudden organic movement.
Step 1: Anchor the Date Window
Start with the date range. Was the movement over seven days, 28 days, month over month, or across a Google update window? Semrush's Organic Rankings Overview allows date range views across traffic and keyword trends, while the Position Changes report can show changed keywords over selected periods. Use the same window across tools so you are not comparing mismatched evidence.
Then add first-party context:
- Google Search Console clicks, impressions, CTR, and average position.
- GA4 organic landing page sessions and conversions.
- Known release dates, migrations, template changes, redirects, or content updates.
- Google update dates or Semrush notes that overlap the movement.
Step 2: Check Whether the Market Shifted
Before you decide your site "failed," check whether the whole SERP changed. Look at the market analysis view, competitor gains, and share of voice movement.
The key question: did demand disappear, or did someone else capture it?
If multiple competitors lost traffic, the issue may be demand, seasonality, SERP layout, or tracking coverage. If your site lost and a small set of domains gained, the issue is more likely competitive. If a platform gained, the issue may be format. If a directory or publisher gained, the issue may be information architecture, authority, or query intent.
Step 3: Find the Topic Clusters That Moved
Topic clusters are usually more useful than individual keyword lists. A single ranking loss can be random. A cluster moving in the same direction is a pattern.
Group losers and winners by:
- Commercial intent.
- Comparison intent.
- How-to intent.
- Brand vs. non-brand.
- Local vs. national intent.
- AI Overview or SERP feature exposure.
For each cluster, write down the likely SERP preference. Is Google rewarding category pages, guides, product pages, comparison tables, local packs, video, forums, or listicles? The answer changes the fix.
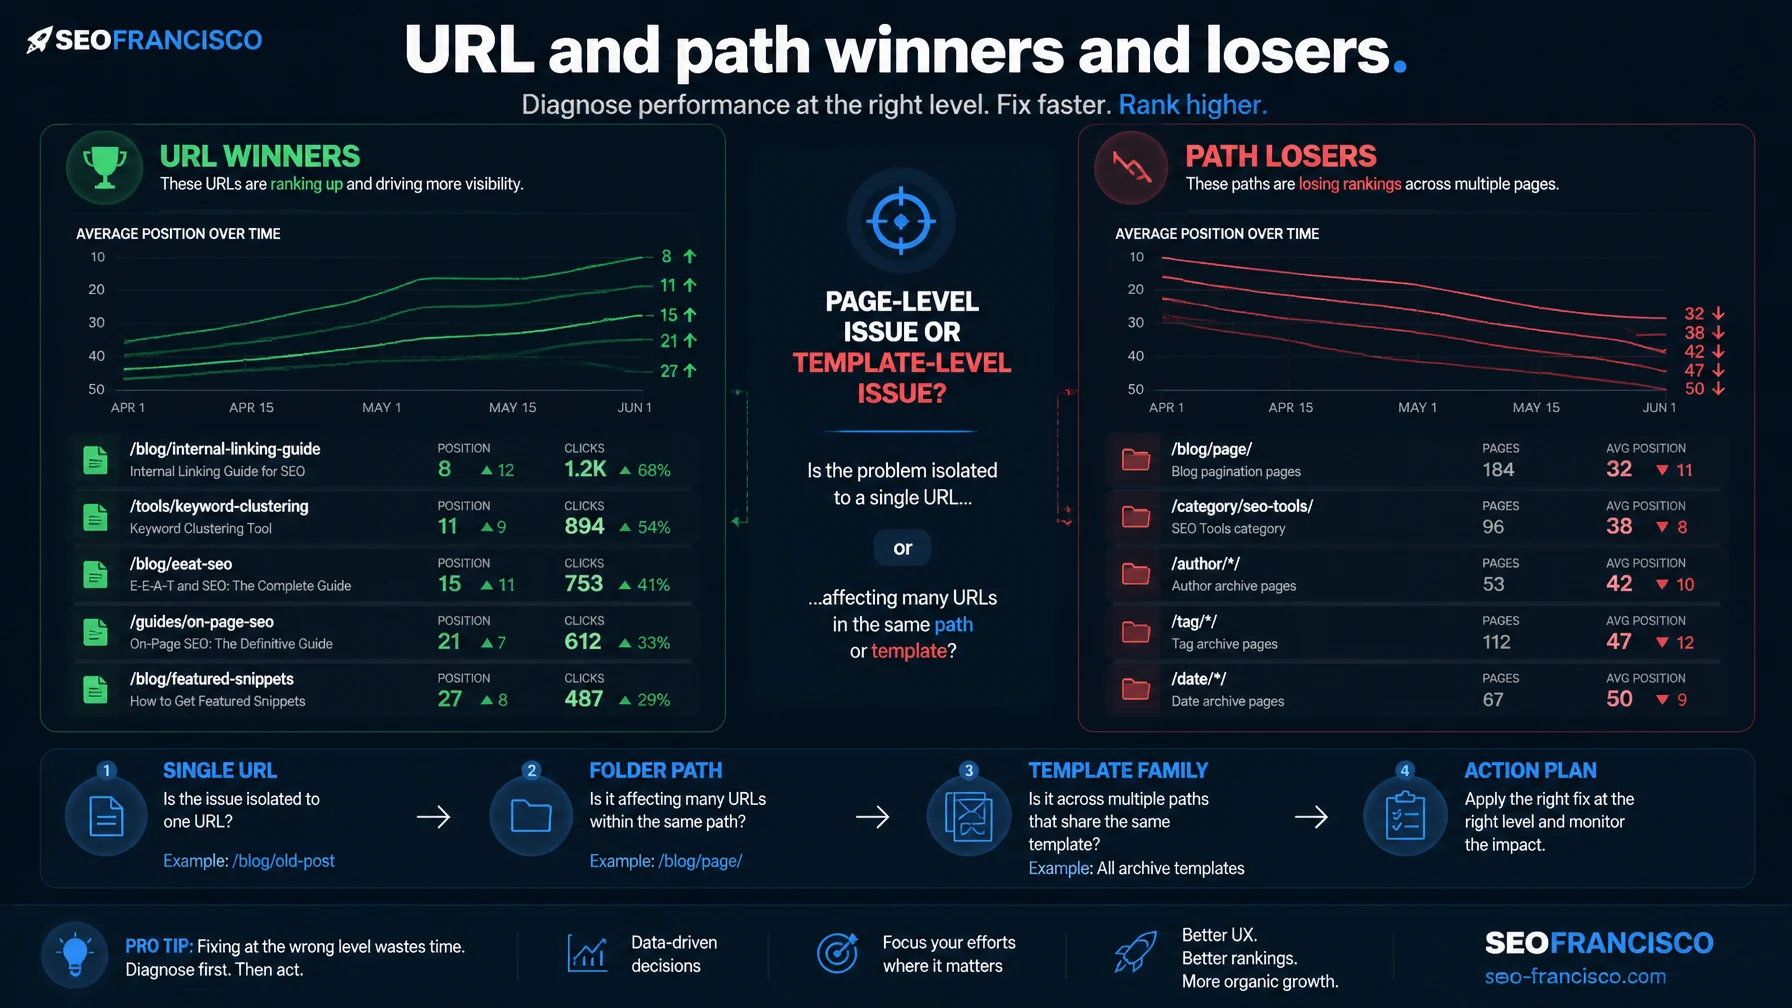
Step 4: Identify URL and Path Losers
URL-level movement tells you what to repair. Path-level movement tells you whether the issue is systemic.
If one article loses traffic, audit that page. If an entire directory loses traffic, audit the template, internal linking, indexing rules, page type, and content pattern. If a product category path loses while editorial content wins, the SERP may have shifted up-funnel. If blog content loses while product pages hold steady, the issue may be freshness, topical authority, or AI answer extraction.
This is where the report becomes more than a reporting shortcut. It helps you decide whether the fix is page-level, template-level, folder-level, or strategy-level.
Step 5: Drop to Keyword Movement
After the market, cluster, URL, and path view, move into the keyword table. Semrush's Position Changes report separates changes into New, Improved, Declined, and Lost. That gives you a clean triage model:
- New: terms now ranking in Google's top 100 that were absent before.
- Improved: terms still in the top 100 that moved up.
- Declined: terms still in the top 100 that moved down.
- Lost: terms that were in the top 100 and dropped out.
Declined terms tell you where recovery may be near-term. Lost terms tell you where Google may have stopped seeing the page as a relevant candidate. Improved and New terms are just as important because they show what Google is rewarding now.
Do not export every keyword and call that analysis. Segment by impact. Start with keywords that changed estimated traffic, conversions, or strategic visibility. Then inspect the live SERP for the terms that changed most.
The 30-Minute SEO Shift Workflow
If you only have half an hour before a stakeholder update, use this order:
| Minute | Action | Output |
|---|---|---|
| 0-5 | Confirm the exact date range in GSC, GA4, and Semrush. | One agreed reporting window. |
| 5-10 | Check market development and share of voice movement. | List of domains that gained or lost visibility. |
| 10-15 | Identify topic clusters and paths that moved most. | Pattern: topic, intent, directory, or template. |
| 15-20 | Open the top URLs and query movements. | Priority page list with estimated impact. |
| 20-25 | Inspect live SERPs for the biggest lost and gained terms. | SERP type change, competitor gain, or feature shift. |
| 25-30 | Write a short diagnosis with confidence level. | Stakeholder-ready summary and next actions. |
The output should be short and concrete:
Organic traffic is down 11% in the selected period. The decline is concentrated in two comparison clusters and one guides directory. Market analysis shows two publishers and one direct competitor gaining share of voice for the same keyword set. The largest losses are Declined, not Lost, which suggests recovery is possible if we update the affected pages, improve internal links, and add fresher comparison proof. We need live SERP review on the top 20 affected queries before finalizing the recovery plan.
That is the kind of reporting leadership can use. It names the movement, the concentration, the competitive context, the likely cause, the uncertainty, and the next step.
How to Turn the Report Into Actions
The report should not end with a screenshot. Every finding should become one of five action types.
Action 1: Refresh the Winning Page Type
If the SERP is rewarding updated comparison content, update comparison pages. If it is rewarding original data, build data. If it is rewarding product pages, improve product information. Do not force the old page type to win a changed SERP.
Action 2: Rebuild Internal Links Around the Moving Cluster
When a cluster starts moving, internal links often lag behind the new priority. Add contextual links from pages that already rank, support pages that explain subtopics, and conversion pages that need authority. Remove invalid internal links that redirect to the homepage or dilute the signal.
Action 3: Map Competitor Format Advantages
If a competitor gained share, check format before copy. Are they using calculators, tables, embedded video, author proof, recent examples, pricing detail, schema, original images, or stronger category architecture? The winning signal may not be sentence-level content.
Action 4: Separate Recovery From Expansion
Declined and Lost keywords are recovery work. New and Improved keywords are expansion evidence. Keep them in separate backlogs. Recovery work protects existing demand. Expansion work tells you where Google is already testing your relevance.
Action 5: Brief the Next Report Before the Next Month
The strongest use of this workflow is not explaining last month. It is setting up the next one. Add annotations for fixes, content updates, technical changes, internal link pushes, and publication dates. If traffic moves again, you need to know what changed on your side.
What This Report Cannot Tell You
No third-party SEO tool can tell the whole story by itself. A Semrush workflow can make diagnosis faster, but it still needs constraints.
- It cannot replace GSC: use Search Console for your actual Google query and page data.
- It cannot replace analytics: use GA4 or server-side analytics for sessions, revenue, leads, and conversion behavior.
- It cannot prove causality alone: market movement is evidence, not proof of why Google changed rankings.
- It cannot judge business relevance: a domain can be a SERP competitor without being a business competitor.
- It cannot inspect your page quality for you: you still need human review of content, UX, E-E-A-T, technical issues, and internal links.
The danger is turning a polished report into a false sense of certainty. The better use is disciplined triage: what moved, where did it move, who gained, which page types won, and what should we check next?
The Practical Takeaway
The best SEO reports are not performance recaps. They are decision tools.
A "What Has Happened" style report is valuable because it changes the reporting sequence. Instead of starting with your own drop and guessing why, you start with market movement. Then you move into topic clusters, URL paths, page winners and losers, keyword movement, and live SERP review.
That is how you avoid the two worst reactions to an organic traffic drop: rewriting pages randomly or blaming an algorithm update before you know who gained.
Frequently Asked Questions
What is the Semrush What Has Happened Organic Research report?
It is a Semrush Enterprise-style organic research report for diagnosing what changed across keywords, topic clusters, URLs, paths, competitors, traffic estimates, rankings, and share of voice during a selected period.
Should I use Semrush traffic instead of GA4 or Search Console?
No. Use Semrush traffic as estimated competitive intelligence. Use Google Search Console for query and page performance, and use GA4 or server-side analytics for sessions, leads, revenue, and conversion behavior.
What is the first thing to check after organic traffic drops?
Confirm the date window, then check whether the market changed. If competitors gained share of voice while your site lost visibility, the next step is to identify which topic clusters, URLs, and page types moved.
Why does share of voice matter more than keyword count?
Keyword count treats every ranking as similar. Share of voice is weighted toward search volume and estimated traffic, so it better shows who is visible for the queries that carry more demand.
How should SEOs use the Position Changes report?
Use New and Improved keywords to understand what Google is rewarding. Use Declined and Lost keywords to prioritize recovery work, especially when the affected terms map to revenue pages or strategic topic clusters.
About the Author